
Co-authored with Gwern Branwen, who did most of the work. Data & code available here.
Updates
- 11/09 3:30pm Pacific: Updated Brier scores, added Simon Jackman, added '2008 Repeat' baseline.
- 11/09 9pm Pacific: Updated scores, added Wang & Ferguson.
- 11/11 2:30am Pacific: Added appendix, updated scores with final batch of data from Wang & Ferguson.
- 11/26 8:30pm Pacific: Updated scores with latest data on e.g. the popular vote.
Obama may have won the presidency on election night, but pundit Nate Silver won the internet by correctly predicting presidential race outcomes in every state plus the District of Columbia — a perfect 51/51 score.
Now the interwebs are abuzz with Nate Silver praise. Gawker proclaims him "America's Chief Wizard." Gizmodo humorously offers 25 Nate Silver Facts (sample: "Nate Silver's computer has no "backspace" button; Nate Silver doesn't make mistakes").
Was Silver simply lucky? Probably not. In the 2008 elections he scored 50/51, missing only Indiana, which went to Obama by a mere 1%.
How does he do it? In his CFAR-recommended book The Signal and the Noise: Why So Many Predictions Fail, but Some Don't, Silver reveals that his "secret" is bothering to obey the laws of probability theory rather than predicting things from his gut.
An understanding of probability can help us see what Silver's critics got wrong. For example, Brandon Gaylord wrote:
Silver... confuses his polling averages with an opaque weighting process... and the inclusion of all polls no matter how insignificant – or wrong – they may be. For example, the poll that recently helped put Obama ahead in Virginia was an Old Dominion poll that showed Obama up by seven points. The only problem is that the poll was in the field for 28 days – half of which were before the first Presidential debate. Granted, Silver gave it his weakest weighting, but its inclusion in his model is baffling.
Actually, what Silver did is exactly right according to probability theory. Each state poll provided some evidence about who would win that state, but some polls — for example those which had been accurate in the past — provided more evidence than others. Even the Old Dominion poll provided some evidence, just not very much — which is why Silver gave it "his weakest weighting." Silver's "opaque weighting process" was really just a straightforward application of probability theory. (In particular, it was an application of Bayes' Theorem.)
Comparing Pundits
But Silver wasn't the only one to get the electoral college exactly right. In fact, the polls themselves were remarkably accurate. John Sides & Margin of Error plotted the national polls along with each poll's margin of error:
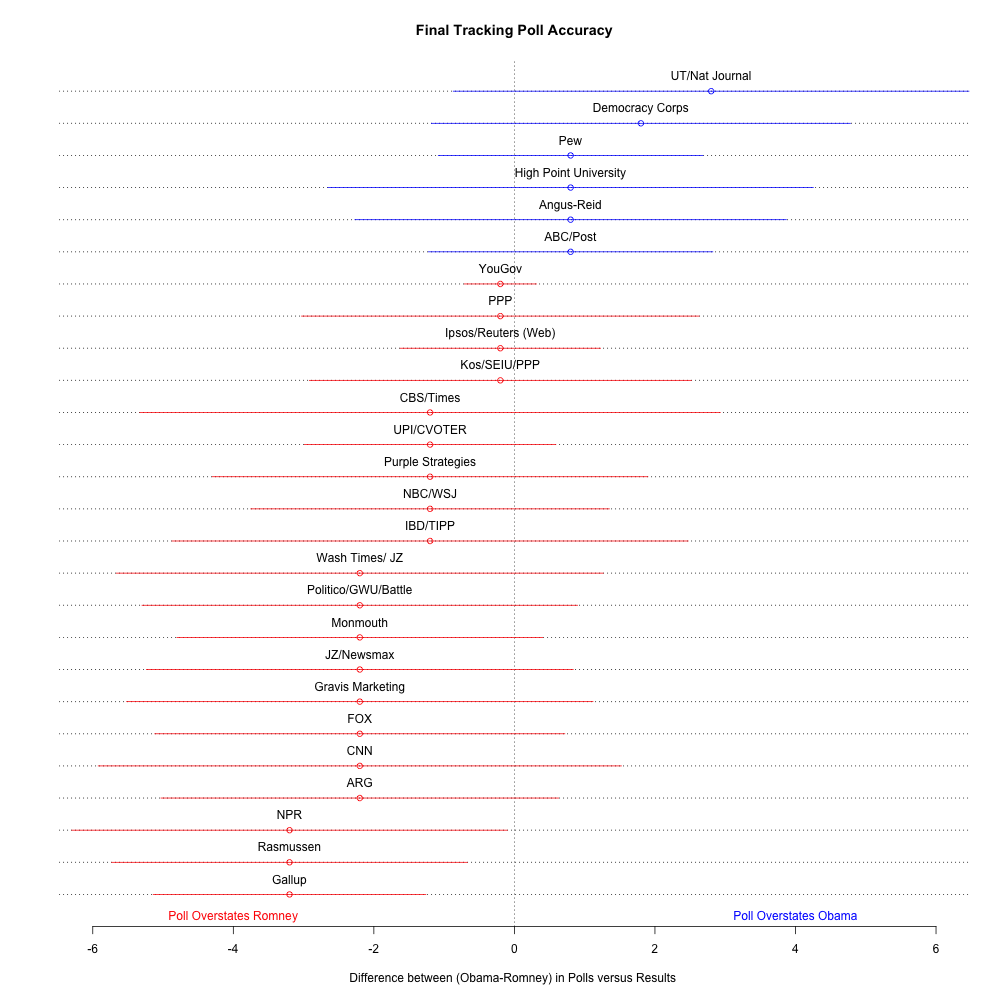
We can see that any bias in the polls was pro-Romney, and also that the true margin of victory fell within the claimed margin of error of almost all the polls! (NPR, Rasmussen, and Gallup were the only exceptions.) This is a sobering graph for anyone who believes statistics is baloney. A larger table compiled by Nate Silver reaches the same conclusion - most polls favored Romney.
So who did best, and how much better did the top pundits do, compared to the rest? To find out, we can't simply compare the absolute number of correct predictions each pundit made.
The reason for this is that pundits (the better ones, anyway) don't just predict election outcomes, they also tell you how confident they are in each of their predictions. For example, Silver gave Obama a 50.3% chance of winning in Florida. That's pretty damn close to 50/50 or "even odds." So if Romney had won Florida, Silver would have been wrong, but only a little wrong. In contrast, Silver's forecast was 92% confident that Rick Berg would win a Senate seat in North Dakota, but Berg lost. For that prediction, Silver was a lot wrong. Still, predictions with 92% confidence should be wrong 8% of the time (otherwise, that 92% confidence is underconfident), and Silver made a lot of correct predictions.
So how can we tell who did best? We need a method that accounts not just for the predicted outcomes, but also for the confidence of each prediction.
There are many ways you can score predictions to reward accuracy and punish arrogance, but most of them are gameable, for example by overstating one’s true beliefs. The methods which aren’t cheatable — where you score best if you are honest — are all called “proper scoring rules.”
One of the most common proper scoring rules is the Brier score. A Brier score is simply a number between 0 and 1, and as with golf, a lower score is better.
So, to measure exactly how well different pundits did, we can compare their Brier scores.
Predictions about the Presidential Race
First, who made the most accurate predictions about state outcomes in the presidential race? We must limit ourselves to those who stated their confidence in their predictions on all 50 state races (plus the District of Columbia). Here are the Brier scores:
| Reality | 0.00000 |
| Drew Linzer | 0.00384 |
| Wang & Ferguson | 0.00761 |
| Nate Silver | 0.00911 |
| Simon Jackman | 0.00971 |
| DeSart & Holbrook | 0.01605 |
| Intrade | 0.02812 |
| 2008 Repeat | 0.03922 |
| Margin of Error | 0.05075 |
| Coin Flip | 0.25000 |
A random coin flip scores badly, with a score 4 times higher than the next worst predictor. This isn't surprising: just about anybody should be able to out-predict a coin toss for the outcomes in California and many other states.
Next worse is the Margin of Error forecast: a very simple model based almost solely on approval ratings and economics. But this alone is enough to jump way ahead of a random guesser.
After that is ‘2008 Repeat’: this is a simple predictor which gives 100% for states that went Obama in 2008, and 0% for the rest. This is a more intelligent predictor than the random coin flip, but still simplistic, so a good forecaster should easily outperform it. Since Indiana and North Carolina did not go Obama in 2012, a better forecaster would have been less than 100% optimistic about them.
Intrade isn’t at the lead as fans of prediction markets might have hoped. The individual state markets are lightly traded, with many never traded at all, and an accurate prediction market needs many well-informed traders. But Intrade is apparently still picking up on some polls, systematically or unsystematically, because it beat the Margin of Error model which largely ignored them. (Some also suggest that Intrade was being manipulated.)
What of more complex models making full use of polls, and run by academics or private individuals skilled at forecasting? We see Drew Linzer, Wang & Ferguson, Nate Silver, Simon Jackman, and DeSart & Holbrook within about 0.01 of each other, with Linzer in the lead. This is interesting since Drew Linzer has not been lionized like Nate Silver.
Also note that Wang & Ferguson got a better Brier score than Silver despite getting Florida (barely) wrong while Silver got Florida right. The Atlantic Wire gave Wang & Ferguson only a "Silver Star" for this reason, but our more detailed analysis shows that Wang & Ferguson probably should have gotten a "Gold Star."
Looking at the Senate Races
Only Silver, Wang, and Intrade made probabilistic predictions (predictions with confidences stated) on the contested Senate races. When we ask what happens if we look at the ~30 Senate races, we get the following Brier scores:
| Wang & Ferguson | 0.0124 |
| Nate Silver | 0.0448 |
| Intrade | 0.0488 |
Wang & Ferguson crushed both Silver and Intrade, by correctly predicting that Montana and North Dakota had 69/75% odds of going to Democrats while Silver gave them both <50%. Further, Silver has only a tiny lead on Intrade. Part of what happened is that Intrade, at least, managed to put 16% on that surprising Rick Berg Senate win instead of Silver’s 8%, and is accordingly punished less by the Brier score (but still enough to be nowhere near Wang/Ferguson).
What if we pit Wang against Silver against Intrade on the state victory odds, the Presidency victory odds, and the Senate victory odds? This is almost all of Silver’s binary predictions and should make it clear whether Silver outperformed Intrade and Wang & Fergusonon his binary predictions:
| Wang & Ferguson | 0.01120 |
| Nate Silver | 0.02674 |
| Intrade | 0.03897 |
Silver did about 1/3 better than Intrade, but Wang & Ferguson did half again better!
Predictions about State Victory Margins
What about the pundits' predictions for the share of the electoral vote, the share of the popular vote, and state victory margins? Who was the most accurate pundit on those points?
We can’t use a Brier score, since a Brier score is for binary true/false values. There is no ‘true’ or ‘false’ response to "How much of the popular vote did Obama win?" We need to switch to a different scoring rule: in this case, a classic of statistics and machine learning, the RMSE (root mean squared error). The RMSE adds up how much each predicted amount differed from the true amount, and penalizes larger differences more than smaller one. (Unlike a Brier score, RMSE scores aren't scored between 0 and 1, but smaller numbers are still better.)
Lots of pollsters reported their predicted margins of victory for states. Below are their RMSE scores:
| Reality | 0.00000 |
| Nate Silver | 1.863676 |
| Josh Putnam | 2.033683 |
| Simon Jackman | 2.25422 |
| DeSart & Holbrook | 2.414322 |
| Margin of Error | 2.426244 |
| Drew Linzer | 2.5285 |
| 2008 Repeat | 3.206457 |
| Unskewed Polls | 7.245104 |
Here, Nate Silver regains a clear lead from fellow polling/statistics buffs Putnam, DeSart, Jackman, and DeSart, the latter of which is closely pursued by Margin of Error. As before, we included a benchmark from 2008: simply predicting that the vote-share will be exactly like in 2008, which performs reasonably well but not as well as the good forecasters.
What happened with ‘Unskewed Polls’? Unskewed Polls was a right-wing website which believed that the standard polls were substantially underestimating the willingness of Romney supporters to go out and vote, so any Romney figure should be kicked up a few percent. This lead to a hugely inaccurate forecast of a Romney landslide. (Note: the Unskewed Polls guy later apologized and changed his mind, an admirable thing that humans rarely do.)
Predictions about State Victory Margins, the Popular Vote, and the Electoral Vote
What happens if we combine the state victory margin predictions with these pundits' predictions for the nationwide popular vote and electoral vote, and calculate an overall RMSE? (This is not quite statistically orthodox but may be interesting anyway.)
| Reality | 0.0000 |
| Josh Putnam | 2.002633 |
| Simon Jackman | 2.206758 |
| Drew Linzer | 2.503588 |
| Nate Silver | 3.186463 |
| DeSart & Holbrook | 4.635004 |
| Margin of Error | 4.641332 |
| Wang & Ferguson | 4.83369 |
| 2008 Repeat | 5.525641 |
| Unskewed Polls | 11.84946 |
Here, Putnam, Jackman, and Linzer take the lead, and the Margin of Error forecast performs almost as well as DeSart despite its simplicity. Why did 2008 Repeat perform so poorly? It ‘predicted’ a total electoral & popular vote blowout (which happened in 2008 but not 2012); here is another low bar we hope forecasters can pass: whether they were able to notice that Obama is not quite as popular as he was in 2008.
Probability Theory for the Win
So, was Nate Silver the most accurate 2012 election pundit? It depends which set of predictions you're talking about. But the general lesson is this: the statistical methods used by the best-scoring pundits are not very advanced. Mostly, the top pundits outperformed everyone else by bothering to use statistical models in the first place, and by not making elementary mistakes of probability theory like the one committed by Brandon Gaylord.
Whether you're making decisions about health, business, investing, or other things, a basic understanding of probability theory can improve your outcomes quite a bit. And that's what CFAR is all about. That's what we teach — for example in this month's Rationality for Entrepreneurs workshop.
5 Summary tables
5.1 RMSEs
| Predictor | Presidential electoral | Presidential popular | State margins | S+Pp+Sm1 | Senate margins |
|---|---|---|---|---|---|
| Silver | 19 | 0.01 | 1.81659 | 20.82659 | 3.272197 |
| Linzer | 0 | 2.5285 | |||
| Wang | 29 | 0.31 | 2.79083 | 32.10083 | |
| Jackman | 0 | 0.01 | 2.25422 | 2.26422 | |
| DeSart | 29 | 0.58 | 2.414322 | 31.99432 | |
| Intrade | 41 | 0.04 | |||
| 2008 | 33 | 2.21 | 3.206457 | 38.41646 | |
| Margin | 29 | 0.71 | 2.426244 | 32.13624 | |
| Putnam | 0 | 2.033683 | |||
| Unskewed | 69 | 1.91 | 7.245104 | 78.1551 |
5.2 Brier scores
(0 is a perfect Brier score or RMSE.)
| Predictor | Presidential win | State win | Senate win | St+Sn+P |
|---|---|---|---|---|
| Silver | 0.008281 | 0.00911372 | 0.04484545 | 0.02297625 |
| Linzer | 0.0001 | 0.00384326 | ||
| Wang | 0 | 0.00761569 | 0.01246376 | 0.009408282 |
| Jackman | 0.007396 | 0.00971369 | ||
| DeSart | 0.012950 | 0.01605542 | ||
| Intrade | 0.116964 | 0.02811906 | 0.04882958 | 0.03720485 |
| 2008 | 0 | 0.03921569 | ||
| Margin | 0.1024 | 0.05075311 | ||
| Random | 0.2500 | 0.25000000 | 0.25000000 | 0.25000000 |
5.3 Log scores
We mentioned there were other proper scoring rules besides the Brier score; another binary-outcome rule, less used by political forecasters, is the “logarithmic scoring rule” (see Wikipedia or Eliezer Yudkowsky’s “Technical Explanation”); it has some deep connections to areas like information theory, data compression, and Bayesian inference, which makes it invaluable in some context. But because a log score ranges between 0 and negative Infinity (bigger is better/smaller worse) rather than 0 and 1 (smaller better) and has some different behaviors, it’s a bit harder to understand than a Brier score.
(One way in which the log score differs from the Brier score is treatment of 100/0% predictions: the log score of a 100% prediction which is wrong is negative Infinity, while in Brier it’d simply be 1 and one can recover; hence if you say 100% twice and are wrong once, your Brier score would recover to 0.5 but your log score will still be negative Infinity! This is what happens with the “2008” benchmark.)
| Forecaster | State win probabilities |
|---|---|
| Reality | 0 |
| Linzer | -0.9327548 |
| Wang & Ferguson | -1.750359 |
| Silver | -2.057887 |
| Jackman | -2.254638 |
| DeSart | -3.30201 |
| Intrade | -5.719922 |
| Margin of Error | -10.20808 |
| 2008 | -Infinity |
| Forecaster | Presidential win probability |
|---|---|
| Reality | 0 |
| 2008 | 0 |
| Wang & Ferguson | 0 |
| Jackman | -0.08992471 |
| Linzer | -0.01005034 |
| Silver | -0.09541018 |
| DeSart | -0.1208126 |
| Intrade | -0.4185503 |
| Margin of Error | -0.3856625 |
Note that the 2008 benchmark and Wang & Ferguson took a risk here by an outright 100% chance of victory, which the log score rewarded with a 0: if somehow Obama had lost, then the log score of any set of their predictions which included the presidential win probability would automatically be -Infinity, rendering them officially The Worst Predictors In The World. This is why one should allow for the unthinkable by including some fraction of percent; of course, I’m sure Wang & Ferguson don’t mean 100% literally but more like “it’s so close to 100% we can’t be bothered to report the tiny remaining possibility”.
| Forecaster | Senate win probabilities |
|---|---|
| Reality | 0 |
| Wang | -2.89789 |
| Silver | -4.911792 |
| Intrade | -5.813129 |